The Path to Better Results: Process Maps
By Deborah Hopen
One of the most common tools used by improvement teams is the process map, sometimes called a process flow diagram. This versatile tool can be applied to processes of all types and serves as the foundation for many analyses and deeper investigations.
Process maps show the sequence of steps from the beginning to the end of a process, making it easier to get an overall look at the process being studied. They are composed of lines and specifically defined symbols that form a universally accepted mapping framework. Flow lines use arrows to connect steps and show the path or direction of the process. View the most common symbols and their descriptions.
Process maps may be quite straightforward or have many variations. In some cases, the process being mapped may have already been documented explicitly in standard operating procedures or training manuals, but in other circumstances, there may be little or no formal information regarding the operations of implicit processes. Even when official documentation is available, there may be notable differences between what has been written and what happens in real life.
Even when you think you know all the steps in your process, making a flow diagram with the help of others can be revealing.
For improvement projects, it is absolutely essential that team members thoroughly understand the process that leads to the current results. Even when you think you know all the steps in your process, making a flow diagram with the help of others can be revealing. This is why most improvement methodologies begin with the creation of a process map that can be used as a reference throughout the project. Ultimately, the process map not only serves as a key investigative tool, but also becomes a means of documenting process changes as improvements are identified and implemented. Process maps are used for communication and education/training in most projects, too.
Developing an accurate process map is more than a “conference-room” activity. Tapping into team members’ knowledge of the process is a good place to start gathering input for the map, but directly observing the process in operation also is important. This is called the genba, or gemba, walk in Lean or Lean Six Sigma projects, based on the Japanese word, which means “the actual place.”
Steps to Fill out the Process Map
- Obtain input from the people who know the most about the process. If they are not available to help draw the diagram, be sure they review and approve it before you use it for analyses or other purposes.
- Define the scope of the process map. Decide how much of the process you need to present to make it useful. All team members should agree on the starting and ending points in order to provide adequate boundaries for the analyses that will be conducted using the process map.
- Decide on the level of detail. It’s usually easier to start with the main steps and then add detail to the ones that have the most impact on the problem or improvement opportunity.
- List and arrange the steps that the process currently follows without worrying about the symbols. Sticky notes work well for this. You can rearrange and insert steps as you discuss the original ideas.
- Document all process variations. As you think about the process, you usually will find many options associated with what originally was thought of as one process. It often works best to make a process map for each variation and then combine them into a master process map that shows how the variations are connected. A decision symbol with multiple labeled options is often used to indicate which path is followed in specific circumstances.
- Once you’ve listed all the steps and arranged them in order, you can discuss each step and select the appropriate symbol for it. Assign the symbols and connect them with arrows to show the flow.
- Observe the actual process to verify your process map. Make adjustments as necessary and make sure to verify them with the process operators.
- Add a footnote to the bottom of the document that indicates the date of its creation and the name of one or more participants who can be contacted if additional information is needed about the process map. This is a good general practice when creating project documentation.
Mid-Level Process Maps, Swim Lane Diagrams
For many projects, an initial high-level process map is used to establish the scope and boundaries. Deeper analyses later in the project often require more detail. Mid-level process maps, or deployment process maps, such as a swim lane diagram, are beneficial for this purpose because they not only clearly show the process flow and variations, but also who is responsible for carrying out each step. The procedure for preparing this type of map is similar to the one described for a basic process map except for these considerations:
- You may choose to use a basic process map for the high-level view and then convert it to the mid-level. It may be beneficial to have both versions available for different analyses, but it should be easy to see how they align.
- Before beginning to propose the process’ steps, determine the individuals and/or groups that will appear as lanes. Each function will be assigned its own lane. The order of the lanes can be based on a variety of considerations, and ease of creating the final process map usually takes precedence.
- When listing and arranging the process steps, also indicate which function is responsible for the work. Insert the step in the appropriate lane when the symbols and connectors are added. Note that some steps may involve more than one function and will stretch across multiple lanes. It is often most convenient to place functions that share steps in adjacent lanes, whenever possible.
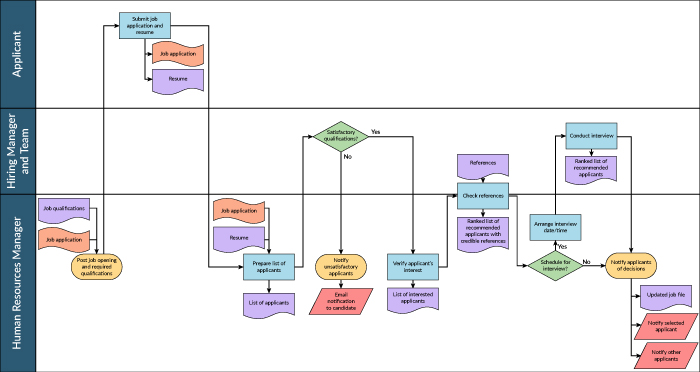
Examples of Completed Process Maps
The figures below show the high-level and mid-level process maps for a company’s hiring process. In this case, the team decided to focus the initial diagram solely on the major activities in the process. This helped to clarify the steps that would be included in the project’s scope.

Once the project team met with the process operators and conducted its genba walk, additional steps were added to indicate the flow more accurately. The inputs and outputs for each step were also incorporated into the mid-level process map at this point. The use of a deployment process map makes it easier to see which functions conduct each step.
Tips for Generating Process Maps
Avoid criticizing or challenging team members who bring up variations in the process. Usually people have a reason for doing things differently; often these differences become the foundation for significant improvements.
Don’t brush off small differences either; make sure you note each of them. Once Ford Motor Co. decided to eliminate one tiny hole (less than 5 millimeters) from the cylinder assembly of the Mustang. That small change ultimately cost them millions of dollars because it slightly reduced the amount of oil that reached the pistons. Virtually every car for that model year had to be recalled when its engine failed!
A Coach’s Perspective
It’s fairly common for teams to rely on just a few of the symbols—the terminal, activity, decision and connector lines are the most common. This actually works fairly well for the high-level process map, but it is far less effective for the mid-level diagram.
Some of the less frequently used symbols provide immediate pointers to potential improvement opportunities.
Some of the less frequently used symbols, such as the delay, transport, storage and inspection symbols, provide immediate pointers to potential improvement opportunities. Asking whether the steps shown within these symbols add value for the customer can be very beneficial. For instance, suppose a storage symbol appears in a manufacturing process map, and it includes the description, “Hold parts for future orders.” This probably would be considered as waste, and the team would set out to eliminate that step. On the other hand, if the process involved making wine and the storage symbol noted “Age wine for six months,” the team members would check the recipe and determine this was a necessary step for ensuring the wine satisfied customers’ expectations.
That’s why I always encourage team members to learn and use all the symbols and to use the actual symbols as the basis for analyzing opportunities for eliminating waste.
Check Your Understanding
Here are some questions for you to consider regarding the use of the process maps. They provide a way for you to evaluate your understanding of this tool quickly.
- What can you do to simplify a process map if it has many variations or becomes overly complex?
- Why is it important to carefully document all the inputs and outputs of the process on your map before developing your fishbone diagram?
- Suppose your deployment flow diagram seemed to be zigzagging back and forth among the function lanes. What would that indicate and why would improvements be worth investigating?
Deborah Hopen has over 40 years of experience in total quality management, and has served as a senior executive with both Fortune and Inc. 500 companies. She is a Fellow of the American Society for Quality and is the editor of ASQ’s Journal for Quality and Participation.